Notes: 1С

My notes about life, work and other fascinating things around me.

Shown: 0 · Page

ThisObject.ThisObject
24 Jule 2020 ·

Tweet

I love JavaScript! Whenever some bizarre nonsense in my beloved platform pisses me off, I open any thread about web developers’ daily lives and calm down quickly, very quickly.

Similar tricks are possible in 1C, though. JavaScript understands window.window.window.location, for example, while the platform understands this :-)

A Broken Bicycle
20 Jule 2020 ·

1C:Drive

I suspect whoever drew this image for 1Ci was about as far removed from developing the configuration, and from programming in general, as possible. Because a programmer sees exactly two messages about the product here:

  1. It reinvents the wheel.
  2. The wheel is broken.
The Size of Data in a 1C Database
11 Jule 2020 ·

Last week, while browsing the 8.3.15 release notes, I came across GetDatabaseDataSize(). I got curious about how it works and how its numbers compare with what you get from, say, Management Studio.

I ended up writing a sort of console to pass various metadata objects to the method, and started watching the platform’s database queries.

Basically, the platform works out the data size with something like this:

CAST(
    SUM(
        CAST(
            DATALENGTH(T1._Fld40) AS NUMERIC(12, 0)
        )
    ) AS NUMERIC(18, 0)
)

It does this for every field in the object, including standard attributes. If there are tabular sections, it counts those too, then sums the results.

Conclusions?

First, now I understand the method’s awkward name. It doesn’t calculate table size, as I initially thought, but data size specifically. The estimate excludes schema overhead, index overhead, and extent allocation. It counts only the size of the data stored directly in the object.

So a product catalog, say, will actually take up more space than this method reports. Possibly a lot more. You wouldn’t use it for precise analysis, but it’s fine for a quick look at where the data is piling up.

Second, the method doesn’t count the data history overhead for the objects being analyzed, which the docs are quite clear about. In theory, you could calculate it manually starting from _DataHistoryMetadata, but let’s wait a release or two: perhaps the developers will add it.

Third, the DBMS reads all the data in the tables it needs, then works out how big that data is. That probably means a whole bunch of scans, which can flush the buffer cache pretty quickly. In 1cFresh, the queries respect data separators, but that’s cold comfort to me.

Use it with care on a live production system.

Exporting Standard Data Processors
5 Jule 2020 ·

We recently swapped out SSLi’s creaky old homegrown versioning for the platform’s built-in data history in our configuration. I’m now finishing data history backup and restore. Surprisingly, neither the Standard Subsystems Library, the Standard Technologies Library, nor SSLi can do this yet, though I didn’t expect it from the last one.

I’ll write more when it’s finished. For now, here’s a neat trick that came in handy: the platform’s built-in data processors available through “All Functions” can be exported as ordinary epf files! Colleagues on Infostart explained the trick in detail here and here. In brief, the magic looks like this:

КопироватьФайл(
    "v8res://mngbase/StandardDataChangeHistory.epf",
    "Q:/StandardDataChangeHistory.epf"
);

The links above have the full list of forms and processors you can pull out, how to get that list, and plenty of people arguing about it all.

Why might this help you? Honestly, I don’t know. In our case, we were building interfaces for data history and were curious about how 1C had written its own. Spoiler: it’s pretty messy.

On Perfect Balance
20 May 2020 ·

I want to share a couple of great pieces about modern software. Neither is exactly new, especially the first, but I’m sure some of you haven’t seen them:

What brought this to mind? Last week, I took part in a hackathon for developers at our company. I learned a lot of cool things and even shared first place with two other people who came up with very similar solutions.

(If you also work at First BIT, the results are on the portal, along with a review by another winner, Dima Leshchenko.)

Along the way, we had to deploy and configure a mountain of software: EDT, RabbitMQ, Docker, GitLab, JIRA, SonarQube, and a wagonload of smaller, simpler tools. All right, no complaints about RabbitMQ: it’s light and fast. But the rest… I already knew EDT had an appetite, but GitLab and JIRA’s hunger really surprised me.

Yes, everything ran in Docker; yes, the configuration wasn’t optimal, with several PostgreSQL servers instead of one, for example; yes, it was Docker for Windows, which every sysadmin I know loves to make jokes about. But twelve gigabytes of RAM straight out of the gate?! I won’t even mention the CPU: the load looked as if the computer were simulating a nuclear explosion in real time.

It’s hard to find a better illustration of Nikita’s points: this software devoured a sea of resources and calmly asked for more before it had even started doing anything useful. But Evgeny has a point too: with one single command, I got several operating systems up and running, complete with some pretty complicated servers. And it took a tiny fraction of the time it would have a few years ago.

I don’t have an answer. I don’t think anyone does. We’ve been having this argument forever. Pick either side, and you still end up trying to find a balance. You need to write good, fast code, while also avoiding premature optimization. Getting the code right feels great: you remember that, damn it, you’re pretty good! The second simply keeps you from losing your mind in search of the perfect bubble sort algorithm :-)

Viewing a Value Table
16 May 2020 ·

I’ve uploaded a short function to GitHub that converts any value table into a spreadsheet document.

Why? So you can see what’s in it. You can’t pass the value table itself to the client, but you can pass a spreadsheet document based on it. A spreadsheet document also has a client-side Show() method that displays it in a separate window.

That way, you can poke around in utility tables right in Enterprise mode, without building an interface for each one. Feed a table to the function above, get a spreadsheet document back, send it to the client, and show it.

Self-Documenting Code
3 May 2020 ·

Hello, everyone! Johnny Catswill is back with another episode of Self-Documenting Code!

Today, we’ll iterate over value table rows from Н to Й:

:|

It seems like a tiny thing, but by the fifth time you run into this kind of variable naming in the same module, your eye starts twitching :-)

It isn’t even that this section is harder to understand; it says a lot about the module’s overall quality. The programmer who wrote it was probably exhausted, and somewhere nearby you’ll likely find something like someone cheerfully dumping the entire product catalog into a value table, reading a bunch of objects “through a dot,” and more of the same slapdash stuff.

IsEmpty() or ValueIsFilled()?
11 April 2020 ·

A few days ago, a colleague and I discussed the best way to check whether a reference is filled. I remembered an instructor telling us, very confidently, to be careful with ValueIsFilled(). Supposedly, it compares the variable with every possible empty value in the configuration, and the whole thing is a huge, slow mess. As an alternative, the instructor recommended the reference’s IsEmpty() method and checking composite attributes roughly like this:

СсылкаЗаполнена = Ссылка <> Неопределено И Не Ссылка.Пустая();

My colleague argued that ValueIsFilled() is faster because it’s a built-in function and doesn’t spend time looking up a method on an object, a relatively slow operation in scripting languages.

I can’t recall either method ever being a bottleneck, but I got curious and wrote a test that checks a reference variable for an empty value both ways and measures the time taken.

The average result looks roughly like this. There are four steps: the first two assume the reference is defined, while the third and fourth add a check for that. The table’s last column shows the execution context, client or server.

The result is pretty clear: ValueIsFilled() doesn’t slow things down at all. It’s actually faster than IsEmpty(), especially once we start checking the variable for Undefined. The difference isn’t enormous, of course, but it could save a couple of seconds in some lengthy scheduled operations.

Besides, one check that works for everything is easier than trying to guess every value the variable might have.

Unresolved References
10 Marth 2020 ·

Unresolved references to metadata objects usually appear when objects are deleted, and sometimes when configurations are merged. ITS has an article with a good explanation of the details.

Broken references don’t always affect the application’s behavior. A field without a data binding is easy to notice, of course. But suppose you delete a functional option: what does it matter if a reference remains somewhere in a form command? It simply sits there like a cut wire, inert and harmless. Nothing passes through it.

Still, these things gradually clutter the configuration and should be removed. The ITS advice isn’t all that helpful: go through every place a broken reference might be hiding. Imagine a complicated document form with lots of controls. How long would that search take? And success isn’t guaranteed.

There’s a rougher way that works: delete groups of controls from the form, one after another. Start with large groups, such as pages. After each removal, check the configuration and see whether the broken reference has disappeared. Before starting, it’s best to delete all form code so the platform doesn’t complain about references to nonexistent controls.

The problem might also be in the form itself rather than its controls, but that’s much easier to locate: settings storage, conditional appearance, commands. There aren’t many candidates.

You can also export the configuration to files and dig through the XML. That’s also worth doing because what you see in Designer can be misleading. If a form command references a missing functional option, for example, you might see nothing wrong in the command’s properties. But the XML will contain a suspicious GUID instead of an option name: practically a signed confession :-)

Filtering Standard Attributes
9 Marth 2020 ·

A short code fragment from the data history settings processor I just wrote about. It checks whether Attribute is MetadataObject’s standard attribute named StandardAttributeName. When is that useful? Suppose you’re iterating over an object’s standard attributes and want to skip one for some reason.

At first glance, the solution looks absurdly convoluted. Why not simply compare the attribute being checked with the one we want to exclude?

If Attribute = MetadataObject.StandardAttributes.Order Then

Because that code doesn’t work: comparing two standard attributes of a metadata object in the 1C platform always returns False.

All right, you might say, why complicate things? How about this?

If Attribute.Name = "Order" Then

That won’t work either if your code runs in a Russian configuration: the standard attribute we’re looking for is then named “Порядок.”

But you can look up the standard attribute in the collection by either its Russian or English name. Then you get its actual name and compare that with the name of the attribute you’re checking.

Of course, we could simply compare the name with both “Order” and “Порядок.” But first, that’s ugly; second, our coding standards don’t allow Russian in the code. I wanted a more general solution.

The Try/Catch is there in case the configuration has no standard attribute with that name at all. Trying to look it up would throw an error.

Data History Settings
9 Marth 2020 ·

I’ve put a data processor on GitHub for setting up the data history feature that arrived in the platform not long ago. Here’s what it does:

  1. Builds a tree of objects that support data history;
  2. Shows which objects currently have data history enabled;
  3. Lets you enable or disable data history for objects and their attributes.

It supports batch operations: for example, you can enable history for several documents and all catalogs at once. Or wipe all your changes and go back to the defaults the configuration developer set.

I think it turned out well. I mostly wrote it for myself, to give my brain a workout in the evenings, but we might even include it in our configuration! Right now, SSLi handles our data versioning, and it’s not exactly efficient: it’s slow and makes the database balloon. Hopefully, the platform will do better when we test it.

You can find similar tools on Infostart and ITS, but they’re either buggy, work only with Russian configurations (no English interface and dependencies on the Russian Standard Subsystems Library), or are just out of date, with no support for constants, for example.

Top Exceptions in the Technological Log
16 February 2020 ·

I’ve published a Bash script on GitHub that identifies the most frequent exceptions in a collected 1C technological log.

It analyzes EXCP events. These are the main source of error information, though certainly not the only one: EXCPCNTX, for example, describes an event that had started but hadn’t finished when an error occurred. Also, if an exception occurs during a server call, the CALL event’s RetExcp field contains the error text returned to the client.

Most of the time, though, EXCP and the occasional EXCPCNTX will do. People often collect them by default: it doesn’t put any real load on the system and lets you run the logs through an analysis tool, such as the script above, to keep a finger on the pulse.

Debugging over HTTP
26 January 2020 ·

At the end of the week, I ran into a rather silly situation: TCP/IP debugging on a 1C server stopped working. Debug mode itself was enabled, but Designer couldn’t “see” the server’s debug contexts.

The silly part is how hard it is to find the cause: the platform gives you no clear error to work with. After checking the obvious possibilities, such as the firewall and ports, all you can do is shrug.

I solved it by switching to HTTP debugging. The overall setup is more complicated, but configuring it is quite simple. Briefly, you need to:

  • Start the server agent service with the “-debug -http” flags.
  • In Designer’s debugging settings (Tools → Options → Debug), select HTTP as the debugging protocol and the cluster debug server as the debug server.

There’s a more detailed walkthrough on ITS.

Unmaintainable Code
18 January 2020 ·

I happened across an example of a 1C query that calculates the difference between two dates in years, months, and days.

The code may work, I haven’t checked, but to me it’s a good example of what not to do. The problem is that its author will forget what most of those if-then-else branches mean within a couple of months, never mind other developers who decide to use it in their projects. The first time someone needs to change it, they’ll be better off throwing it out and writing something clearer.

And this is far from the most striking example. Just look at regular expressions for validating email addresses. Makes you want to step outside for some air, doesn’t it? :-)

One Thousand and One Nights with 1C
16 January 2020 ·

The architect of our main product (who also happens to be my team lead) talks about how we implemented 1C in Dubai. He doesn’t get bogged down in technical details, so you only need a rough idea of the subject to follow along.

The video was recorded at a developer conference in Krasnodar last June, so a few things have changed since then. For example, we now have working prototypes of the application in Arabic, and our automated testing has grown so much that Miss Vanessa pretty much deserves her own spot on the team :-)

Fifty Times Faster
5 December 2019 ·

Here’s the brief: a client’s month-end closing document takes just under an hour to post. The database isn’t especially big, but an hour is still way too long. Sure, you don’t close the month very often, and you could do it at night. Still.

I dig into the code, profile it, and see that the platform spends almost all that time in a single procedure, executing a query batch. I look at the first query and think: classic, accessing data through a dot on a composite type. The DBMS must be attaching a wagonload of joins to huge document tables, and the optimizer can’t come up with a decent plan in time.

I test the theory. But SalesDocument includes only eight document types. That should be manageable: the usual rule of thumb is that the optimizer can find a decent plan with up to eight joins.

I check the document tables: they aren’t particularly big. I run the query separately from the batch. It isn’t instantaneous, reading around 350,000 records and selecting about 200,000, but it certainly doesn’t take an hour.

All right, the batch’s first query is heavy, but it’s not the problem. I look at the second and realize that we’ve just read the entire Inventory register and selected most of its records, and now we’re reading it again and joining both result sets on a pile of conditions. The register’s record table has no suitable index: only the standard recorder index, which naturally doesn’t help.

I check: this is exactly where the platform spends most of its time waiting for the DBMS.

I couldn’t find a way around reading the whole register table twice. Every alternative I tried meant changing how the data was stored, and that wasn’t an option. So I went with a compromise: in the second query, I replaced the join to the actual register record table with a join to a temporary table created in advance and indexed on the join fields.

This was a case where 1C’s general recommendation worked perfectly: posting time fell from 50 minutes to three, and after further code optimization, to one minute. Fifty times faster than where I started.

A minute for month-end closing is usually fine, so I called it a day.

What Is the Performance Management Center For?
24 November 2019 ·

You use the Performance Management Center to:

  1. Find a system bottleneck, such as slow code or a heavy query;
  2. Investigate specific locks or deadlocks.

For the first one, turn on query analysis and, say, server call analysis. The results show which parts of the system load the application server and which load the DBMS server. This is often done without a specific problem, simply to remove bottlenecks and give the system more headroom for the future.

For the second, turn on lock or deadlock analysis when you know they occur and want a report: who blocked whom, when, on which line of code, and so forth.

In both cases, monitoring runs only during peak load, for ten to fifteen minutes. That keeps the pile of raw data manageable. PMC has to chew through it before it can show you anything, and the more you collect, the longer that takes. You also avoid picking up unrelated stuff, like load from overnight maintenance jobs.

It also keeps the collection itself from slowing things down too much. PMC can collect a monster of a technological log, and your hardware will feel it. Thirty percent slower? Hold my beer. Be careful with that.

PMC’s analytical indicators are sufficient for all of the above: query analysis, lock waits, and 1C and MS SQL deadlock analysis. Operational indicators, such as the number of queries running and their total execution time, are less popular. They usually aren’t worth the time it takes to set them up, and PMC was never really designed to collect them continuously.

Finding Methods with a Parameter
18 November 2019 ·

The task: find methods in a configuration’s common modules that have a specific parameter, DecimalPlacesFor in this example.

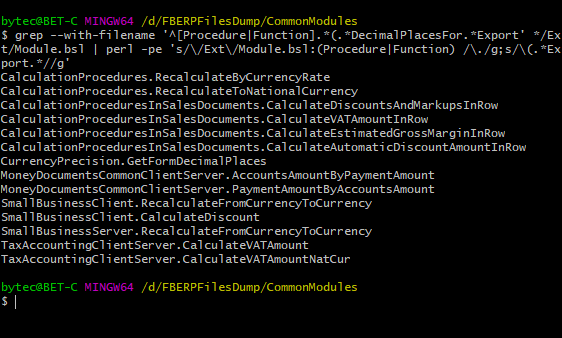
A normal search through the configuration code produces many false positives, such as every reference to a parameter with that name inside method bodies. The platform doesn’t support regular expression searches yet, so the easy way is to export the configuration to files and run a Bash script on the common modules directory.

The bit before the pipe does the searching. The rest trims the output down to module names and the methods found in them. For example:

Console screenshot

Profit? Profit!

What Is Bablox?
20 October 2019 ·

I watched Evgeny Filippov’s webinar about Bablox. Basically, it’s another way to measure performance. Like Apdex, it relies on timing operations, but uses a different calculation.

To calculate Bablox, multiply an operation’s duration by the salary rate of the user performing it. The salary can be:

  • An average value, if you want a rough performance comparison of the same application across several companies.
  • The user’s actual salary, if you need to convince management to spend some money on making things faster.

You end up with a figure for how much money the business has lost to a slow application. That’s the big selling point: it’s a number the average CFO can get their head around. Explaining what an Apdex of 0.5 means takes some effort; explaining a loss of 300,000 rubles doesn’t.

It also takes the guesswork out of questions that come up in every implementation. Take deciding which operations matter most: which matters more, selling goods faster or receiving them into the warehouse? Once you know how much money the company loses on each operation, the answer is much easier.

Of course, it’s not a perfect model. Suppose the application is slow for warehouse workers but runs fine for accountants. Warehouse workers earn less, so their Bablox will be low. But accountants depend on what the warehouse workers enter. Until that’s done, they have nothing to work with. The company is losing money because the application is slow for warehouse workers, but Bablox won’t show it.

I doubt Bablox will knock Apdex off its perch in the IT world, but it’s an interesting idea, and it could make talking to clients a whole lot easier.

A Large 1C Implementation
15 October 2019 ·

What counts as a large 1C implementation? In Russia, the platform is used almost everywhere, even in companies that use a lot of competing software, like SAP. Of course, some implementations are small, with 1C handling purely practical tasks like generating reports. But the Corporate Technology Support Center’s work includes truly enormous projects, such as optimizing the Delovye Linii system for five thousand concurrent users.

So in Russia these days, hundreds of people working in the same infobase at once is a medium-sized implementation. A thousand or more is a large one.

The size of the database doesn’t tell you much on its own: many configurations don’t involve large numbers of concurrent users. A classic example is 1C:Document Management; a less classic one is Avibus’s Bus Terminal Management. Bus Terminal Management can collect huge amounts of data in its central database from remote nodes in its distributed network of bus terminals and stations, without having many users working simultaneously.